Link copied to clipboard
The Agile Work Profiler (AWP) is a skills and career assessment inspired by The DeBruce Foundation’s (DBF’s) objective to broaden career opportunities for individuals. The notion of agility has two critical implications in the evolving economy. First, individuals often have strengths that are assets in a variety of career domains, even when such domains are seemingly dissimilar and are thus unlikely to be considered meaningful options. When making employment decisions, people customarily consider a limited set of homogenous work options, typically within a single career domain. The notion of agility implies that the person may succeed in a diverse set of options both within a given career domain and across several different domains. Such an approach to work is becoming increasingly consequential in an economy where people change jobs and make different career moves more frequently than before. Second, the notion of agility implies that the individual can build new strengths based on interests in different opportunities in the world of work. Thus, an Agility is a capability that can be improved over time, depending on the individual’s scope of career interests. The wider the scope of interests, the broader the opportunities for the person to consider determining which of their capabilities, if any, should be improved (and to what degree) in order to pursue their interests.
The fields of labor force development, career counseling, and human resource management offer a rich array of tools that help individuals explore their skills, abilities, and interests in making work-related decisions. Employers, educational institutions, and social service agencies also use such tools for recruitment and guidance. However, these instruments and the related practices often assume that optimal results arise from narrowing individual choices—that is, from matching the individual to a limited, homogenous set of options. This practice is traditionally seen as an effective means to greater value creation for the individual and the economy. Existing instruments and practices also tend to view the individual’s skills and abilities as comprising a static set of capabilities. Therefore, they overlook the possibility that a broader scope of individual interests can act as a guidepost to help build new strengths that facilitate the pursuit of new opportunities. A third aspect of conventional approaches is that existing tools are typically unable to directly relate an individual’s capabilities to all occupational choices that exist in the economy. This oversight is a critical weakness when the objective is to expand career choices and opportunities. The AWP was conceived to address these three characteristics. It is designed to:
- expand and diversify one’s career opportunities,
- guide individual efforts to build new strengths in light of a wide range of occupational interests, and
- enable the person to make career choices and assess whether they need to build new strengths in light of how their existing capabilities and interests relate to all occupational options in the economy.
Data and methods
The AWP draws on dynamic data available from the Bureau of Labor Statistics (BLS). The BLS periodically surveys members of each occupation in the U.S. on the role of various skills, abilities, and work activities (i.e., specific tasks) in their occupation. It formally classifies about 970 occupations for data collection. Each occupation includes, on average, 60 jobs (sub-occupational titles), thus altogether covering nearly 60,000 jobs in the U.S. economy.[1] The development of the AWP was based primarily on work activity data (as opposed to data on skills and abilities) for two reasons. First, work activities (e.g., analyzing information, operating mechanized vehicles, coaching others, organizing daily tasks, caring for others, selling products) are behavioral properties of work and more open to being acquired or learned by the individual, compared to deeper skills and abilities, which tend to be more attitudinal and may therefore require greater effort in potential processes of individual change. In some cases, skills and abilities are construed in close proximity to personality traits (e.g., ‘originality,’ ‘social sensitivity’) which are notoriously difficult to change. The behavioral activity data, on the other hand, specifies which particular work tasks—instead of personal traits—are important in a given occupation. The second reason for preferring the work activity data was its quality over the data for skills and abilities. BLS surveys about 30 individuals from each occupation for work activities, resulting in a total sample size of nearly 30,000 responses across the 970 occupations.[2] In contrast, only about seven individuals from each occupation are surveyed for skills and abilities, limiting the reliability and predictive quality of the collected data.
The analysis supporting the current version of the AWP uses BLS work activity data from 2017. This dataset involves survey responses on 42 different work activities from about 30 individuals within each of the 966 occupations specified by BLS’ 2015 occupational dictionary. Each of the 42 work activities falls into one of four general types of work behaviors:
- information input (five activities)—where and how are the information and data gained that are needed to perform this job?
- interacting with others (17 activities)—what interactions with other persons or supervisory activities occur while performing this job?
- mental processes (10 activities)—what processing, planning, problem-solving, decision-making, and innovating activities are performed with job-relevant information?
- work output (nine activities)—what physical activities are performed, what equipment and vehicles are operated/controlled, and what complex/technical activities are accomplished as job outputs?[3]
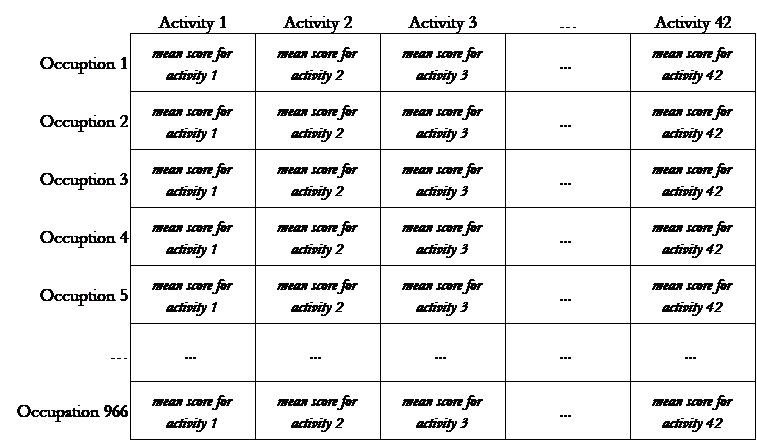
For each activity, the respondent is asked to evaluate how important it is to perform the activity in their respective occupation. This rich data source was transformed into a two-dimensional (966×42) matrix. Each of the 966 rows represented an occupation with a distinct and fixed standard occupation code (SOC) assigned by BLS and used nationally by employers. Each of the 42 columns represented the averaged survey responses for a given activity across the occupations. For instance, as shown in Figure 1, the first cell in row 1 contained the mean score from about 30 individuals regarding the importance of Activity 1 in Occupation 1. The next cell in the same row contained the mean score from the same respondents regarding the importance of Activity 2 in Occupation 1. The next cell in row 1 had the same information about Activity 3, and so on. This 966×42 matrix was then used for identifying empirical themes across occupation/activity ratings.
Analysis
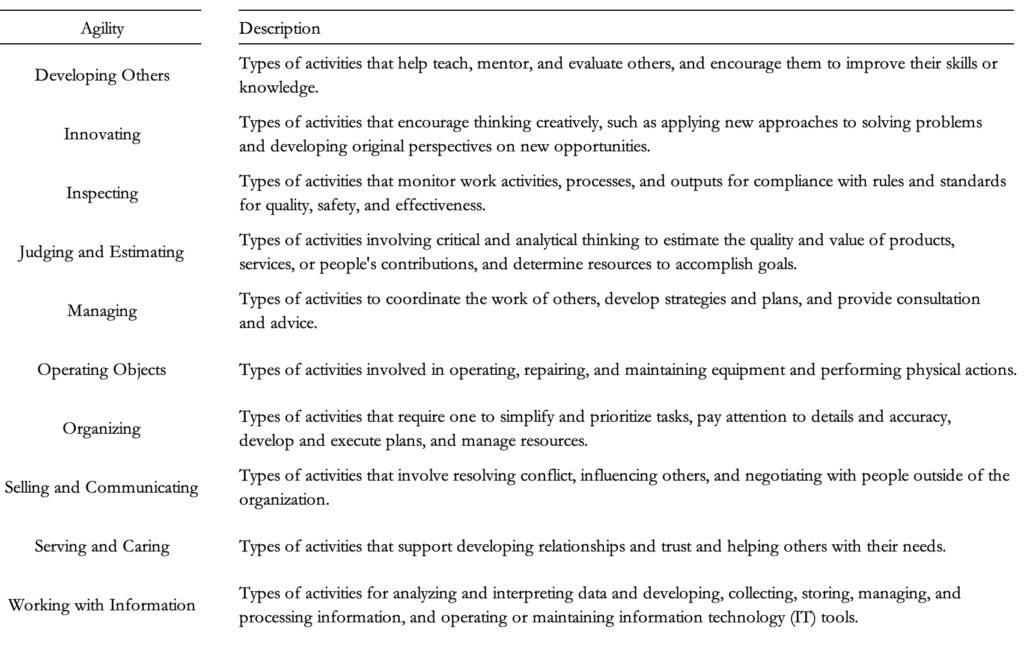
DBF used fuzzy clustering techniques to identify themes in the work activity rating matrix shown in Figure 1.[4] First, occupations with similar activity rating patterns were identified using various homogeneity criteria. Practically, this starts with asking if there are occupations (rows) in the matrix where the mean scores resemble those in row 1 more than those in any other row. When all such rows are identified, they are excluded from the subsequent step, where the question is whether there are rows in which the scores resemble those in row 2 (if this row is not excluded at the end of the previous step) more than those in any other row. The procedure is repeated until rows are clustered to a degree where only a few unclusterable rows remain if any. Next, the same approach is used for the columns in the matrix, clustering those that look alike until only a few unclusterable ones remain if any. In simple terms, the matrix in Figure 1 is squeezed first vertically, then horizontally until it cannot be squeezed further. The objective of this reduction is to determine the least amount of activity clusters that can be used to describe all occupations. Cluster formulas for combining different columns are then used to reconstruct a cluster score for all occupations that went into the original analysis, resulting in a new matrix with 966 rows but with justifiably fewer columns (work activity clusters). Each column in the reduced matrix is defined as an Agility, empirically denoting a work activity theme in the economy. This analysis helped identify 10 Agilities that apply to a different degree to each of the 966 occupations (966×10 matrix). These 10 Agilities are shown in Table 1. Given the 10 Agility scores for individual occupations in the reduced matrix, the scores in each row are then sorted to profile each occupation, starting with the Agility that has the highest in the occupation, and ending with the Agility that has the lowest score. This ranking is akin to having a dictionary that describes every occupation in terms of the same 10 Agilities, but where occupations vary in terms of how the Agilities in them are sorted in terms of importance. The reduction in columns—from 42 activities to 10 Agilities—allows for greater similarity between different occupations, though fundamental distinctions are maintained since Agilities within the rows are sorted in descending order.
Instrument construction
The AWP is a self-assessment questionnaire comprised of 10 psychometric scales, each of which captures the spirit of a given Agility shown in Table 1. Scale items were crafted in reference to both the initial 42 work activities underlying the Agilities and original fieldwork conducted by DBF with various test samples. They are shown in Table 2. The respondent is asked to rate each item twice: first in terms of “how good” they are in performing the stated task, and then in terms of “how much they enjoy” performing the task, which helps capture the sense of interest in the task.
| Developing Others Mentor, coach, teach, and evaluate others Encourage people to improve skills and knowledge |
| Innovating Apply new approaches Think creatively Share new ideas |
| Inspecting Improve quality, safety, or effectiveness Makee processes consistent with rules Assess outputs to standards |
| Judging and Estimating Forecast quality and value of products, services, or people’s contributions Determine resources to accomplish goals |
| Managing Coordinate work of others Develop strategies and plans Provide consultation and advice |
| Operating Objects Inspect, repair, and maintain equipment and surroundings Perform physical actions |
| Organizing Pay attention to details and accuracy Monitor and control resources Sequence tasks and work |
| Selling and Communicating Convince or influence others Work with people outside of the organization Resole conflict and negotiate |
| Serving and Caring Develop relationships and help people Empathize with others and serve their needs Build trust and emotional bonds |
| Working with Information Analyze and interpret data Develop, collect, store, and manage information |
Table 2. Agile Work Profiler items
The “good at” responses are acquired on a seven-point Likert scale. The “enjoy” responses are acquired on a five-point Likert scale. The scale items were evaluated by means of confirmatory factor analysis (CFA) procedures, which indicated a high degree of discriminant and convergent validity, despite the three deliberately overlapping (i.e., cross-loading) items (e.g., between Operating Objects and Judging and Estimating; see Table 2). The items loadings on latent factors varied between 0.450 and 0.925 within any given scale, and the overall model fit met accepted criteria (CFI=0.903, NFI=0.909, RMSEA=0.080).[5] Conventional alpha reliabilities ranged from 0.775 to 0.860. Scale-level scores are calculated as means for items involved in each scale. These averages are determined separately for “good at” and “enjoy” responses. Next, for each scale, the “good at” and “enjoy” responses are aggregated as a total scale, or Agility, score. A sample assessment is shown in Figure 2.
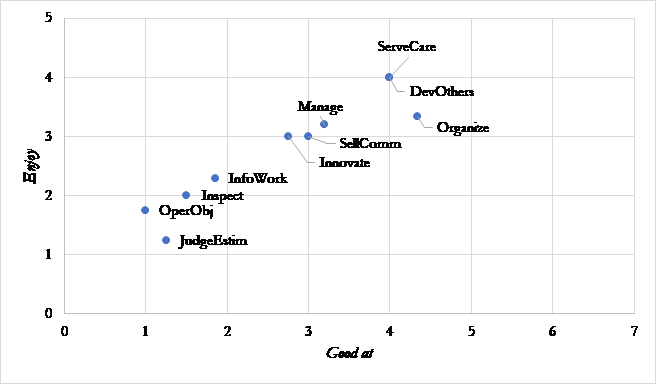
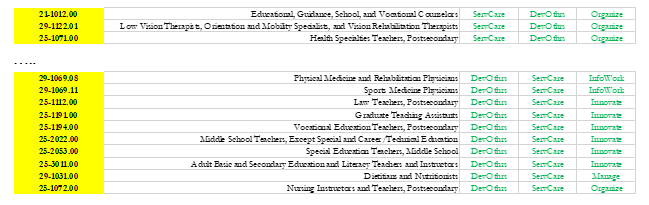
In this sample assessment, the individual’s top Agilities are Serving and Caring, Developing Others, and Organizing. Their mid-range Agilities are Managing, Selling and Communicating, and Innovating. Their low-score Agilities are Working with Information, Inspecting, Operating Objects, and Judging and Estimating. Consistent with the original motivations underlying the AWP, such results: (1) expand and diversify the individual’s career opportunities; (2) guide individual efforts to build new strengths in light of a wide range of occupational interests (e.g., improve the low score Agilities); and (3) enable the individual to make related career choices and to assess whether they need to build new strengths in light of how their existing capabilities and interests are related to all occupational options in the economy. All three objectives are facilitated by exposing the individual to information on occupations with Agility profiles that vary in the degree to which they resemble the individual’s profile. For instance, Figure 3 displays a sample of seemingly dissimilar occupations for the profile shown in Figure 2. A full display further expands potential career choices and informs the individual about how his/her current Agilities relate to the economy and how various Agility improvements may open the door to even more opportunities. The highlighted column indicates federal SOC codes.
DBF continuously procures other information about occupations—such as actual employment prospects, income trends, and educational requirements—which, combined with an AWP score, provides a robust means to foster more effective and diverse career choices for individuals. DBF’s efforts are driven by its core mission to expand pathways to economic growth and opportunity. One way to achieve the mission is to use the AWP to broaden opportunities for all individuals in our evolving economy.
[1] Further detail can be found here: https://www.onetonline.org/find/descriptor/browse/4.A
[2] Details on sampling can be found here: https://www.onetcenter.org/dataCollection.html
[3] Further detail can be found here: https://www.onetonline.org/find/descriptor/browse/4.A
[4] For a review of these techniques, see: Bezdek, James C. 2017. A Primer on Cluster Analysis: 4 Basic Methods that (usually) Work. Sarasota, FL: First Edition Design Publishing. Also, see Miyamoto, Sadaaki, Hidetomo Ichihashi, and Katsuhiro Honda. 2008. Algorithms for Fuzzy Clustering: Methods in c-Means Clustering with Applications (Studies in Fuzziness and Soft Computing). Berlin, Germany: Springer.
[5] See Brown, Timothy A. 2015. Confirmatory Factor Analysis for Applied Research. Second Edition. New York, NY: Guilford Press.